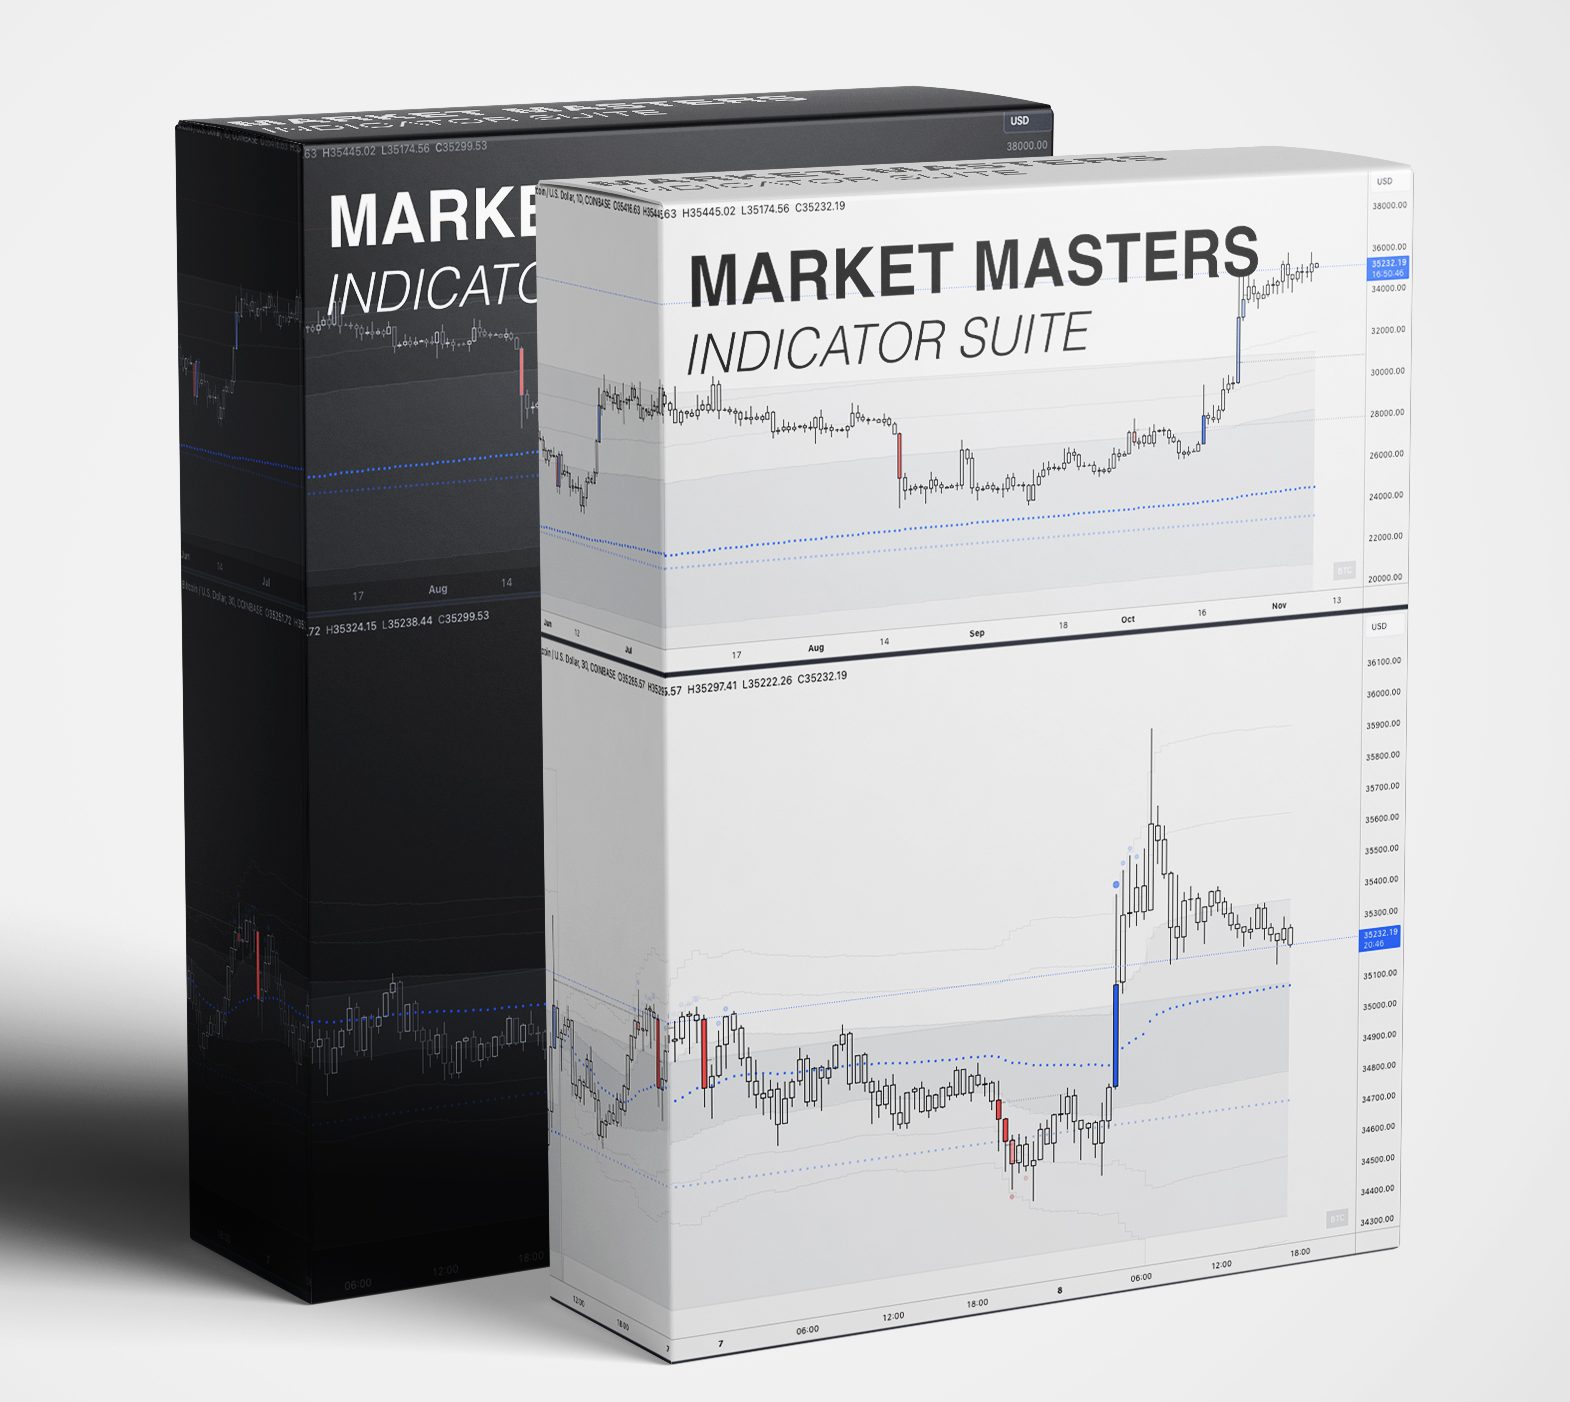
Market Masters Indicator
Bring High Precision To Your Trading Decisions And Optimise Your Profit-Taking Strategies…
Maximise your trading output, with minimal input.
Optimal trade execution and positioning, streamlined analysis and real-time alerts…
While spending less time behind your screen and being notified when lucrative trade conditions exist.
Our Indicator Suite is built for traders who demand accuracy and efficiency in their trading journey.
Overlay the exact indicators we use in your own account and trade with a higher level of confidence.
Experience the power of real-time analytics and tailored strategies to not only identify the most opportune moments for entry but also to optimise your exits for maximum profitability.
What you will receive as part of the Premium TradingView Indicator Suite
- LTVW – Long Term VWAP – Aggregated VWAP tool with bonus features to make it a fully comprehensive high & low time frame trading system
- VWAP W/M/Q/Y lines – Provides an easy way to view all VWAP Time Period (Daily/Weekly/Monthly/Yearly) lines on the one chart for a quick reference
- DR Strategy Indicator (Defining Range as taught in the course)
- Hi/Lo/Churn Volume Bars – Volume candle chart which highlights volume candles based and provides alerts based on criteria of RSI and moving averages.
- Candle Vol Profile – Creates volume profiles for individual candles for basic orderflow trading techniques.
- RSI + Div + Piv – RSI tool with alerts of Divergences, Pivots and Overbought/oversold and extreme Overbought/Oversold conditions
- Dual Double Smoothed Stochastic – provides 2 versions of the Double smoothed Stochastic oscillator for high timeframe analysis.
See detailed descriptions at the bottom of the page.
Examples:
LTVW – Long Term VWAP
Dynamic Value Area Identification: Uncover real-time market trends, with a dynamic value area that evolves with the market, ensuring you stay ahead of the curve, even through periods of volatility.
Leverage Historical Data: Gain a competitive edge with insights into previous/static value areas to make informed decisions based on historical market performance.
Holistic Market Analysis: Seamlessly integrate both developing and previous value areas, offering a comprehensive view of market movements for strategic and confident trading decisions.
Previous Quarter Analysis: Spot new opportunities and anticipate market shifts with ease for more effective positioning.
Precise Trend Tracking: Monitor and capitalise on upward trends, ensuring you make the most of upward market movements.
Optimised Profit Strategies: Benefit from clear visual take-profit paths, allowing for strategic and timely exits to maximise your gains in any market.
Capitalise On Breakouts: Master the art of breakout trading on higher timeframes with clear signals for STRONG entry points for long positions.
Smart Retest Strategy: Pinpoint retest opportunities above previous quarter values, offering a strategic edge in confirming trend strength and sustainability.
Also included in the Premium TradingView Indicator Suite
-
VWAP W/M/Q/Y lines – Provides an easy way to view all VWAP Time Period (Daily/Weekly/Monthly/Yearly) lines on the one chart for a quick reference
-
DR Strategy Indicator – Defining Range indicator with extensive statistics for the RDR, ODR and ADR.
-
Hi/Lo/Churn Volume Bars – Volume candle chart which highlights volume candles based and provides alerts based on criteria of RSI and moving averages. Used in conjunction with the Candle Vol Profile indicator below to identify changes in the market, mousetrap setups and reversals.
-
Candle Vol Profile – creates volume profiles for individual candles for basic orderflow trading techniques.
LONGING example using the Hi/Lo/Churn Volume Bars in conjunction with the Candle Vol Profile indicator
SHORTING example using the Hi/Lo/Churn Volume Bars in conjunction with the Candle Vol Profile indicator
5. RSI + Div + Piv – RSI tool with alerts of Divergences, Pivots and Overbought/oversold and extreme Overbought/Oversold conditions

6. Dual Double Smoothed Stochastic – provides 2 versions of the Double smoothed Stochastic oscillator for high timeframe analysis.

Market Masters Indicator Suite –
Full description
Market Masters Premium Tradingview Indicator Suite is a fully comprehensive high & low time frame trading system. Its strength is based around building directional bias through our fully aggregated long term VWAP system (LTVW) that allows for the user to monitor market conditions and define if the market is ranging or trending. The system also builds multi time frame lines in the sand allowing the user to create a bullish, neutral or bearish bias based on the static and dynamic levels it forms in real time.
We originally built the LTVW indicator for our own trading edge and due to the large amount of success it has brought us we believe it’s too good not to share. The indicator suite cuts down on screen time allowing the user to get their life back instead of spending countless hours doing mundane technical analysis. With the alert system a user can be notified when to be at their computer looking for trades allowing you to spend more time away from the screen.
The LTVW indicator also comes with an expanding library of fully customisable indicators that assist in trending strength & momentum as well as signalling early potential reversals in the market for best trade location execution.
We plan on continuing building this out with what we & the community believe will create the best all rounder indicator suite. With well over 20 years experience combined we have spent our time sorting what indicators are useful, needed modifying or completely being built from the ground up to create the sharpest edges for your trading and investing.
The Premium TradingView Indicator Suite comes with the following indicators:
LTVW – includes
- Aggregated sources for VWAP – professionally selected multi exchange data gathering providing maximum accuracy for VWAP levels.
- Auto VWAP time period selection based on chart timeframe for clarity and ease of transferring between high and low timeframes.
- Date Anchored VWAP for High Time frame predictions for whole cycle VWAP.
- Developing and previous VWAP lines and labels with values for accuracy.
- Adjustable Standard Deviations and Value Area High/Low
- Monday/Weekly range lines for precision range trading(open high low mid etc)
- High Volume Points of Control – precision calculation of highest volume points on high volume candles based on moving average and highest volume candle within range.
- Inbuilt alerting system for line crossings and important levels.
DR Strategy (Defining Range as taught in the course)
What I believe is the best DR tool in the market, provides statistics on the ticker you are trading, with DR, ODR and ADR results so you can identify the best times to be trading.
Especially design to reduce screen clutter with auto functions to remove when not on the 5m chart, only adds line when DR is in play (high or low) and provides all the standard lines used in the strategy for entries, midline, retirement line etc, plus all the multiples, and only adds lines in the direction of trading.
And of course – the signature Alerting system – lets you relax and get on with work and life, knowing that you’ll be alerted when the DR strategy is in play and key levels are hit so you can divert your focus to set up entries and exits.
Hi/Lo/Churn Bars
Extremely good when used in conjunction with the Candle Vol Profile indicator below to identify changes in the market, mousetrap setups and reversals. Separate Volume candle chart which highlights volume candles based on criteria below and also highlights candles on main price chart and provides inbuilt alerts for:
- Highest/Lowest Volume in lookback range – this indicates the highest and the lowest volume bars in the last 30 bars (or set to whatever you want) bar color changed when this condition is triggered.
- High / Low Volume based on moving average – i.e. condition is triggered when the bar volume is above the % of SMA set in the settings..
- Churn bars – low price change per bar, based on EMA of the High/low price of the bars, but high volume based on SMA of volume. Both values are adjustable in the settings so you can customise to a particular ticker or timeframe.
- RSI Overbought and Oversold condition coinciding High/Highest volume – used to indicate exhaustion and possible trapped traders or reversal conditions.
Candle Vol Profile
This tool creates volume profiles for individual candles. This allows users to trade using basic orderflow trading techniques to identify when the highest volumes are traded. It can be used in conjunction with other tools such as RSI overbought/Oversold, Long Term VWAP, Orderblocks and EMA’s (particularly 100/200 4H and 100/200 Daily EMA’s) to find clear levels where traps have occurred, or liquidity has been tapped/stops hunted by bigger players.
Includes:
- Automatic volume profile on Highest volume candle within range specified.
- Volume profile on any specified candle and the previous candle for in depth analysis.
- Point of control(POC) with label of price and volume for accuracy and comparison.
RSI + Div + Piv
Separate Relative Strength Index indicator provides:
- RSI chart with overbought, oversold and extreme overbought and oversold lines.
- RSI Divergences and Pivots based
- Inbuilt alerts to highlight conditions and triggers.
- Adjustable labelling and highlighting methods for ease of assessment of conditions.
Dual Double Smoothed Stochastic (DDSS)
This indicator provides 2 versions of the Double smoothed Stochastic oscillator for high timeframe analysis.
- The Blau Method – The Double Smooth Stochastic by William Blau is a version of a stochastic oscillator first promoted by Dr. George Lane in the 1950′s. In this version of stochastics the numerator (close – period low) and the denominator (period high – period low) are separately, doubly smoothed, with EMA’s and the quotient multiplied by 100. A signal line (SDSS), which is an EMA of the Double Smoothed Stochastic (DSS), is plotted to help trigger buy and sell signals.
- The Bressert Method – this is a simpler version based on one from Bressert which is the normal Stochastic with an EMA applied twice. The difference is the EMA is not applied to the individual components as with the Blau method.
VWAP W/M/Q/Y Lines
Provides an easy way to view all VWAP Time Period (Daily/Weekly/Monthly/Yearly) lines on the one chart for a quick reference either trading levels by itself or in conjunction with the HiLoChurn and Candle Profile indicators – ideal for trading alts on lower timeframes. This is not meant to be a replacement to the LTVW indicator or the 4 screen system for BTC as it doesn’t include the Aggregated data from all the relevant exchanges.
Soon to be released
- Silver Bullet strategy indicators
- Stacked Divergences – including all your favourite oscillators and divergence indicators
- High Probability Order Blocks – Previous Daily High / Low Markings – Session High / Low Markings – Kill Zones / silver bullet zones & Session Mark Outs


